Failing to freelance in data visualizationAfter freelancing in data visualization for a little over a year, I decided to call it quits. I reflect on what went wrong and what you…Jan 24, 20221Jan 24, 20221
Published inUX CollectiveWhy I’m finally learning to drawI’ve hit a roadblock in my dataviz creative process, so I set on a journey to learn how to draw. I embark on this new challenge motivated…May 15, 2021May 15, 2021
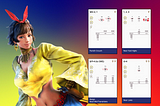
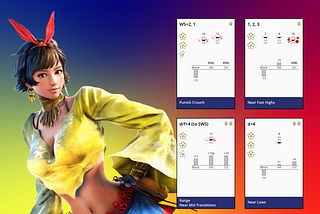
Published inNightingaleHow Tekken ReInvented My Data Visualization Design ProcessEngaging the community around this fighting game challenged me to rethink my approach to creating data vizSep 3, 20201Sep 3, 20201
Published inNightingaleHow Self-Employed Data Visualization Designers Make a LivingInterviewing four designers about how they started—and made—their careers in data visualizationMar 31, 20206Mar 31, 20206
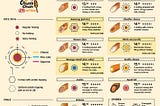
Published inBootcampCase study: Redesigning a Korean food menu with data visualizationHow can the ordering experience be improved with data visualization?Mar 23, 20201Mar 23, 20201
Published inNightingaleHow I Quit My Full-Time Job To Pursue a Freelance Career in Data VisualizationThe pros and cons: what I’ve learned in the first four monthsDec 9, 20193Dec 9, 20193
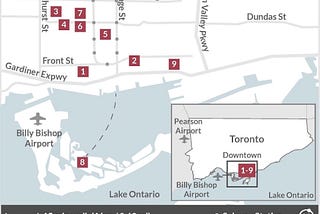
Published inThe StartupRedefining Travel Guides with Data VisualizationI was planning a trip a couple months ago and struggled to plan it by myself. Trying to work within a budget, I did a lot of research on…Sep 13, 2019Sep 13, 2019
Unzipped Toronto: Reviewing the Exhibit’s Information DesignThe Unzipped exhibit by Bjarke Ingels Group (BIG) visited Toronto in the fall of 2018. It was a very photogenic exhibit and the pavilion…Jan 21, 2019Jan 21, 2019
Published inPrototyprHow IKEA Allows Us to Dream: Reviewing the 2019 IKEA Canada CatalogueDiscretion: the following analysis is my opinion alone. I was not endorsed to write this and it was completely out of appreciation and…Dec 18, 20183Dec 18, 20183
Published inSwap LanguageThe Delights and Frustrations of Learning Chinese CharactersHow I Started to Learn Chinese as a Second Generation CanadianSep 14, 20181Sep 14, 20181